Analyzing HTTP Processes
This function lets experienced developers observe the behavior of their applications and improve their performance.
The process analysis produces a file, available from the root of your account (called analysis_[date]-[time].log and that can be viewed in SSH or FTP) describing the operations performed by the process during a set period of time.
1. Start the analysis
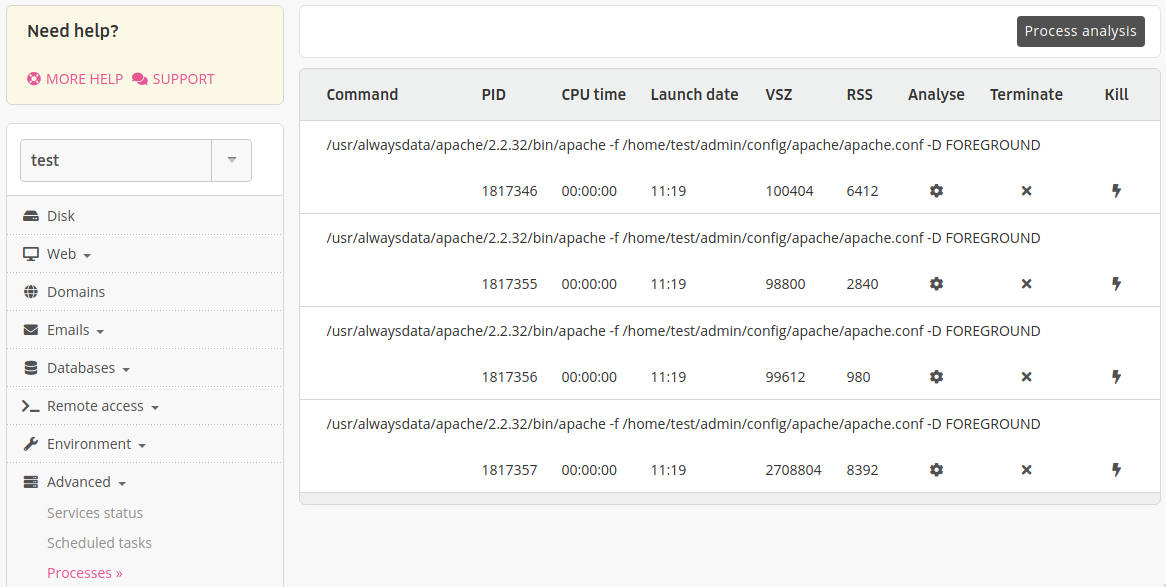
The process analysis function is available via Advanced > Process > Analyze the processes.
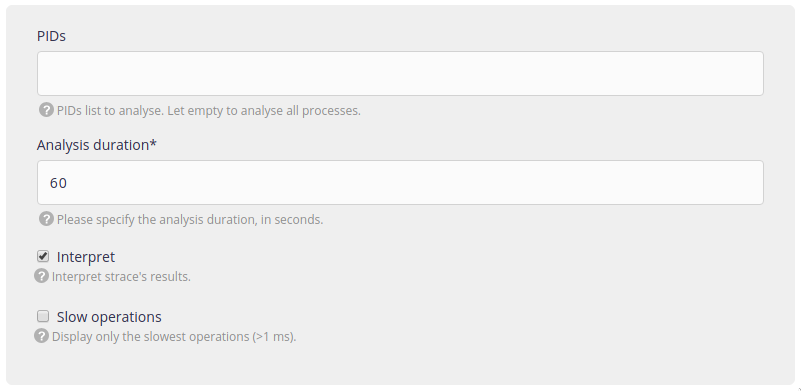
PIDs: list of PIDs for the processes to audit, separated by a space. If this field stays blank, all of the processes that respond to HTTP requests will be analyzed.
Analysis duration: once the analysis is started, it will last for the indicated time (in seconds). Generally 30 to 60 seconds suffice. The analysis will only work if pages from your site are displayed, so leave enough time to display a few pages, but avoid saving too much data as this may complicate reading the result.
Interpret: by default, the analysis results match the results of a call to
strace1, which may be hard to read. If this option is enabled, the result will be interpreted and filtered.Slow operations: by activating this option, only the operations considered as slow (lasting for at least 1 ms) or major ones will be displayed.
Once the analysis has started, simply view the pages to be monitored from your browser, while the analysis is ongoing.
Note
The PID for a process is displayed in the process table displayed in the Advanced > Process menu. Sometimes, no processes are visible in this table. They will appear if you visit a few pages of your web site.
Warning
The file produced by the analysis may comprise sensitive data like passwords. We recommend deleting it.
2. Understanding the results
The content of the file containing the analysis results contains one operation per line, like these (which are shortened and cropped for legibility reasons):
5857 16:16:57.265015 0.029 ms Send data (MySQL) ("SELECT * FROM posts
                              WHERE posts.post_type = 'page' ORDER BY
                              posts.post_date DESC"...)
5857 16:16:57.265105 53 ms    Wait until being able to receive data (MySQL)
These lines comprise the PID for the process that performed the operation, the time when it was run, its duration and the operation.
Here, we can see that an SQL request was sent to the MySQL server. Sending the request only took 0.029 ms which is very fast, but the next line shows that there was a 53 ms wait until the MySQL server was ready to send an answer and this is far slower.
Note
All of the results are not so obvious: very often, even if none of the operations is really slow, it is the large number of them that slows down the site. In this case, run the analysis again while disabling the Slow operations filter.
Imprecise operations
Sometimes a process may start while the latter was still answering an HTTP request. The analysis tool will not be able to accurately interpret the operations performed for the current request. In this case it is better to look for the start of the next request. These can generally be found thanks to a line that looks like this:
73510 16:53:04.551317 1.08 s Wait for incoming connection from socket...More information is available from the strace tool. ↩︎